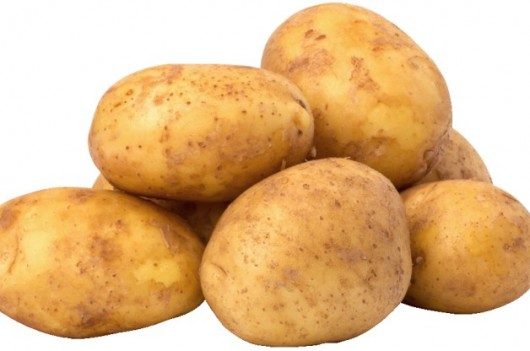
Potato Production and Imports in Mauritius: An Eight-Year Overview (2015-2022)

Potatoes are a global food staple and play a significant role in Mauritius’s food culture. In this blog post, we’ll take a detailed look at potato farming and imports in Mauritius over the past eight years. Let’s dive into the data to discover the trends and insights from this period.
Years
2015: A Good Start
- February: The year began with an import of 1,792 metric tons of potatoes.
- March: Another substantial import of 1,540 metric tons.
- April: Importation continued with 1,064 metric tons.
- May: Imported 616 metric tons.
2016: Changing Times
- June: Local potato production started with 5.5 metric tons, and 66 metric tons were imported.
- July: A significant local harvest of 73 metric tons and an import of 1,373 metric tons.
- August: Local production continued with 79.8 metric tons, and 1,380 metric tons were imported.
- September: A substantial local harvest of 152 metric tons, and an import of 3,226 metric tons.
- October: Notable local production of 212 metric tons, and 4,997 metric tons were imported.
- November: Local production remained significant at 139.8 metric tons, and 4,431 metric tons were imported.
- December: Local production continued with 43.9 metric tons, and the year ended with an import of 954 metric tons.
2017: Ups and Downs
- March: Importation of 1,540 metric tons.
- April: Importation continued with 1,372 metric tons.
- July: A local production of 50.8 metric tons and an import of 788 metric tons.
- August: Local production reached 73.7 metric tons, and 1,489 metric tons were imported.
- September: An import of 1,678 metric tons.
- October: Imported 3,523 metric tons.
- November: Importation continued with 3,508 metric tons.
- December: Imported 1,829 metric tons.
2018: Unstable Times
- February: Imported 1,708 metric tons.
- March: Imported 924 metric tons.
- April: Imported 616 metric tons.
- May: Imported 924 metric tons.
- June: Local production of 1,316 metric tons.
- July: Imported 560 metric tons.
Year 2019: Mixed Trends
- March: Imported 1,060 metric tons.
- April: Imported 1,280.3 metric tons.
- May: Imported 1,344 metric tons.
- June: Imported 224 metric tons.
- July: Local production of 29.9 metric tons.
- August: Imported 111.5 metric tons.
- September: Imported 135.4 metric tons.
- October: Imported 183.9 metric tons.
- November: Imported 144.1 metric tons.
- December: Imported 95.6 metric tons.
2020: Significant Changes
- February: Imported 972 metric tons.
- March: Imported 1,260.6 metric tons.
- April: Local production of 6.8 metric tons, and an import of 2,964.15 metric tons.
- May: Imported 1,372 metric tons.
2021: A Shift in the Landscape
- February: Imported 3,956.7 metric tons.
- March: No imports recorded.
- June: Local production of 7.9 metric tons, and an import of 123 metric tons.
- July: Local production continued with 51.8 metric tons, and an import of 961 metric tons.
- August: Local production reached 93.1 metric tons.
- September: Imported 123.2 metric tons.
- October: Imported 182.2 metric tons.
- November: Imported 169.7 metric tons.
- December: Imported 51.9 metric tons.
2022: Recent Developments
- February: Imported 2,333.413 metric tons.
- March: Imported 3,319.82 metric tons.
- April: Imported 1,540 metric tons.
- May: Imported 1,166 metric tons.
- June: Imported 1,286.5 metric tons.
- July: Imported 1,824.5 metric tons.
Key Points:
- The potato industry in Mauritius saw fluctuations in both local production and imports over the years.
- Importation patterns varied, with notable peaks in 2017 and 2021.
- The absence of imports in March 2021 indicated changes in supply dynamics.
Conclusion:
These statistics provide valuable insights into the potato industry in Mauritius from 2015 to 2022. They reveal the dynamic nature of potato production and imports, with different years standing out for their contributions to the market. Monitoring future data will offer a clearer picture of how these trends evolve.


